I am trying to make some plots for lots of samples and I a legend for each of the samples. The problem is the legends don’t fit inside the canvas and are drawn vertically in one column. Is there a way to control the legend options like their fontsize, their position,… etc.
at the moment all control options for the legend are hard coded, exposing them in the plot sub command should be easy (at least for font size and legend position).
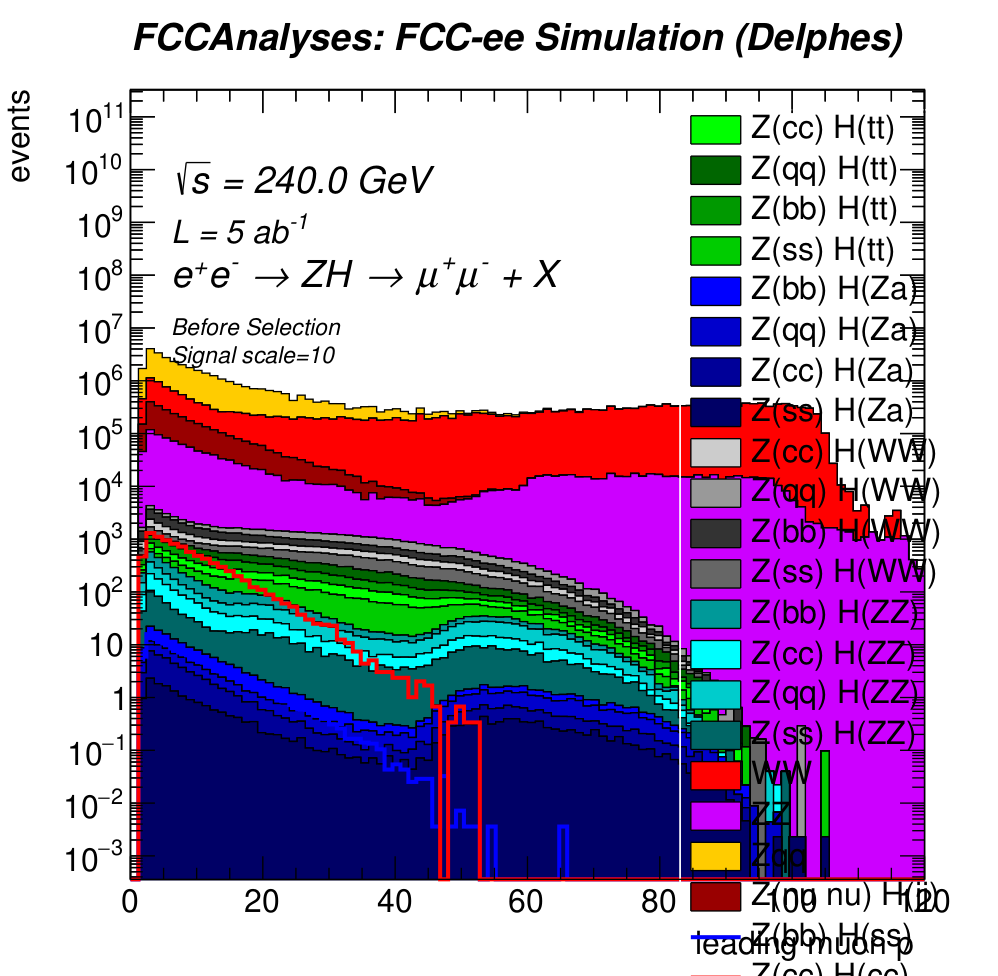
Can you share an example print screen of what is happening in the plot?
now the PR is merged into pre-edm4hep branch and also to master, you should be able to manipulate position of the legend and also size of the font used in the legend.
Command line arguments are: --legend-text-size, --legend-x-min, --legend-x-max, --legend-y-min, and --legend-y-max.
The script attributes are: legendTextSize and legendCoord (expects list of four values).
Hi @jsmiesko
Thank you for adding the legend options. I would also suggest adding TLegend.SetNColumns(n).
If you want the legend to not be in just one column.